How consumers use digital technology and its impact on their lives
In recent years, digital technology has experienced significant transformations.
While it was already progressing, the pandemic acted as an accelerator, enhancing consumers’ confidence and driving demand for communication tools and resources to manage various aspects of their daily routines.
The 5g network began to spread between 2019 and 2020, with a huge leap in connection speed that is supporting this demand and further advancement of digital technology and its applications.
Let’s take a look at the key changes of the last few years and how people’s behaviors and habits are evolving over time.
Access to internet
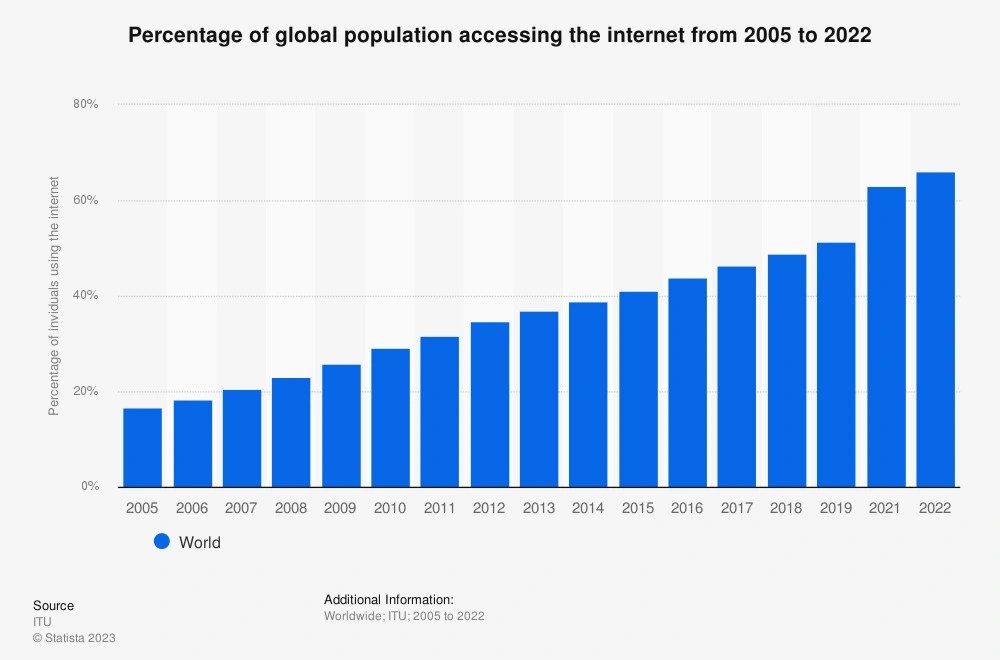
Over the last 20 years, the percentage of Internet users has consistently risen by 2 to 3 percentage points annually.
During the 2019–2021 period, there was an increase of almost 12%, coinciding with the Covid-19 pandemic, and currently, over 64% of the global population accesses the internet [1].
Alongside, the 5th generation of mobile technology began to spread from 2019–2020, leading to a subsequent connection speed increase of up to 10~20 Gigabyte per second [2].
This ongoing process also supports the advancement of IoT technologies, among other benefits.
Digital devices used by audiences
Concerning digital devices used by audiences, mobile phones have been the primary tool for accessing the internet since 2016, followed by desktops and laptops [3].
Today, 59% of website traffic comes from people using mobile devices [4] and this percentage is growing from year to year.
Note that the same users often own and use multiple devices, that’s why a multichannel presence became vital during the last decade.

How customers search for information
With regard to how customers search for information, Google is still the most consulted search engine and Google Images has become the second most prominent platform in recent times [5].
In 2018, a Visenze study [6] indicated that 62% of Gen Z and Millennial consumers prioritized visual search capabilities over other new technologies.
Visual search is considered particularly relevant for clothes and furniture, but visual is considered more valuable than textual information for cars, groceries and vacations too [7].
At the same time, voice search increased too, as more than 1 out 4 of the global online population was already using the voice search feature on their mobile devices in 2019 [8].

What consumers buy online
But what do consumers buy online?
Media ranks as the leading category for online purchases, followed by toys and hobby goods, office equipment, electronics, sporting goods, and clothing. It’s expected that by 2027, the percentage of media bought online will reach 83% [9].
Finally, it’s worth noting that travel bookings and entertainment are among the services most frequently purchased online [10].
Online videos consumption
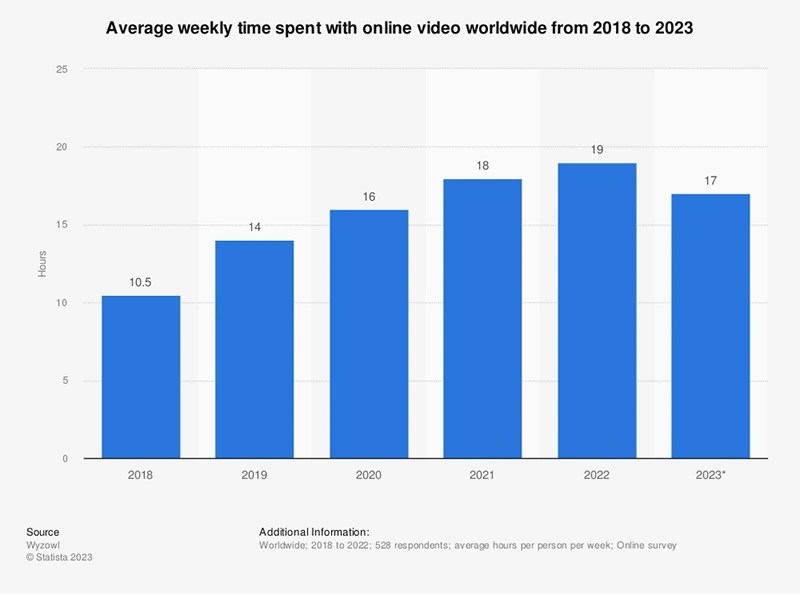
Another relevant evolution concerns online videos.
Online videos are experiencing a growing demand, with video consumption rising from 10.5 hours per week in 2018 to 17 hours per week in 2023 [11].
According to a Wyzowl research, 91% of consumers want to see more online video content from brands and it’s estimated that in 2022 82% of the global internet traffic came from video streaming and downloads, based on a Cisco research [12].
Consumer trends
Talking about consumer trends, Mobile shopping has impressively increased in recent years. In the US, mobile commerce is projected to account for nearly 9% of total retail by 2026 [13].
Currently, 49% of mobile users use their smartphones to compare product or service prices, while 88% of consumers have at least one shopping app installed on their phones [14].

Other relevant trends concern:
- social media buying, with Millennials and Gen Z as the leading advocates and trailblazers of social media purchasing [15];
- a spreading interest in AR/VR technology, since they can reassure about products features and details, simulating the user experience [16];
- privacy concerns, that remain high, as a consistent percentage of consumers express reluctance to allow companies to track their data and the need for further reassurance [17].
Finally, consumer demand for brands aligned with social issues is on the rise, yet this inclination is strongly influenced by local economic, political, social, and cultural factors [18].
Numerous other significant data can be found on my presentation on Slideshare.
Originally published on Medium, August 16, 2023
REFERENCES
[1], Fig. 1. Statista (November 2022). Percentage of global population accessing the internet from 2005 to 2022, Worldwide. [Online image] Available from: https://www.statista.com/statistics/209096/share-of-internet-users-worldwide-by-market-maturity/ [Accessed 2 August 2023]
[2] Cisco. What Are 5G Speeds?. [Online] Available from: https://www.cisco.com/c/en/us/solutions/what-is-5g/what-are-5g-speeds.html/ [Accessed 2 August 2023]
Fig. 2. Datareportal (January 2023). Mobile’s share of web traffic over the years. [Online image] Available from: https://datareportal.com/reports/digital-2023-global-overview-report/ [Accessed 3 August 2023]
[3] The Guardian (November 2016). Mobile web browsing overtakes desktop for the first time. [Online] Available from: https://www.theguardian.com/technology/2016/nov/02/mobile-web-browsing-desktop-smartphones-tablets/ [Accessed 3 August 2023]
Fig. 3. Rand Fishkin from SparkToro (April 2018). Search Engine market share, US. [Online image] Available from: https://innovecs.com/blog/mobile-commerce-app-features/ [Accessed 4 August 2023]
[4] Datareportal (January 2023). Mobile’s share of web traffic. [Online image] Available from: https://datareportal.com/reports/digital-2023-global-overview-report/ [Accessed 3 August 2023]
Fig. 4. Statista (March 2023). Average weekly time spent with online video worldwide from 2018 to 2023. [Online image] Available from: https://www.statista.com/statistics/611707/online-video-time-spent/
[Accessed 6 August 2023]
[5] Rand Fishkin from SparkToro (April 2018). Search Engine market share, US. [Online image] Available from: https://innovecs.com/blog/mobile-commerce-app-features/ [Accessed 4 August 2023]
Fig. 5. Criteo. Leading smartphone activities. [Online image] Available from: https://www.tidio.com/blog/mobile-commerce-statistics/ [Accessed 6 August 2023]
[6] BusinessWire (November 2018). New Research from ViSenze Finds 62 Percent of Generation Z and Millennial Consumers Want Visual Search Capabilities, More Than Any Other New Technology. [Online] Available from: https://www.businesswire.com/news/home/20180829005092/en/New-Research-ViSenze-Finds-62-Percent-Generation#.W4eYrWp5Mrc.linkedin/ [Accessed 4 August 2023]
[7] Intent Lab (February 2019). Consumers Prefer Visual to Text Information When Shopping Online. [Online image] Available from: https://www.marketingcharts.com/industries/retail-and-e-commerce-107475/ [Accessed 4 August 2023]
[8] Microsoft (April 2019). 2019 Voice report: Consumer adoption of voice technology and digital assistants. [Online] Available from: https://about.ads.microsoft.com/en-us/insights/2019-voice-report?fbclid=IwAR2DiZpTmjVfEBddR8ZQM_JWj_S23CBc9Whxwfk1bKnGcG-8W1qDKt8IsIs/ [Accessed 4 August 2023]
[9] InsiderIntelligence / eMarketer. Ecommerce penetration by category, 2023. [Online image] Available from: https://www.tidio.com/blog/ecommerce-statistics/ [Accessed 5 August 2023]
[10] MiQ (February 2020). Estimated Frequency of Online Shopping, by Category Articles. [Online image] Available from: https://www.marketingcharts.com/charts/estimated-frequency-of-online-shopping-by-category/ [Accessed 5 August 2023]
[11] Statista (March 2023). Average weekly time spent with online video worldwide from 2018 to 2023. [Online image] Available from: https://www.statista.com/statistics/611707/online-video-time-spent/ [Accessed 6 August 2023]
[12] Oberlo (January 2023). Video marketing statistics that you need to know in 2023. [Online image] Available from: https://www.oberlo.com/blog/video-marketing-statistics/ [Accessed 6 August 2023]
[13], [14] Tidio (July 2023). Top 10+ Mobile Commerce Statistics for 2023. [Online] Available from: https://www.tidio.com/blog/mobile-commerce-statistics/ [Accessed 6 August 2023]
[15] Hubspot (July 2022). The Top Channels Consumers Use to Learn About Products [New Data]. [Online image] Available from: https://blog.hubspot.com/marketing/how-consumers-learn-about-products [Accessed 8 August 2023]
[16] Yougov (June 2021). Interest in AR/VR for Shopping Comparatively Low in the US. [Online image] Available from: https://www.marketingcharts.com/industries/retail-and-e-commerce-117565/ [Accessed 8 August 2023]
[17], [18] Hubspot (August 2023). The State of Consumer Trends in 2023. [Online] Available from: https://blog.hubspot.com/marketing/state-of-consumer-trends-report/ [Accessed 9 August 2023]
