Exane BNP Paribas
Infographics: Digital Competitive Map, July 2015
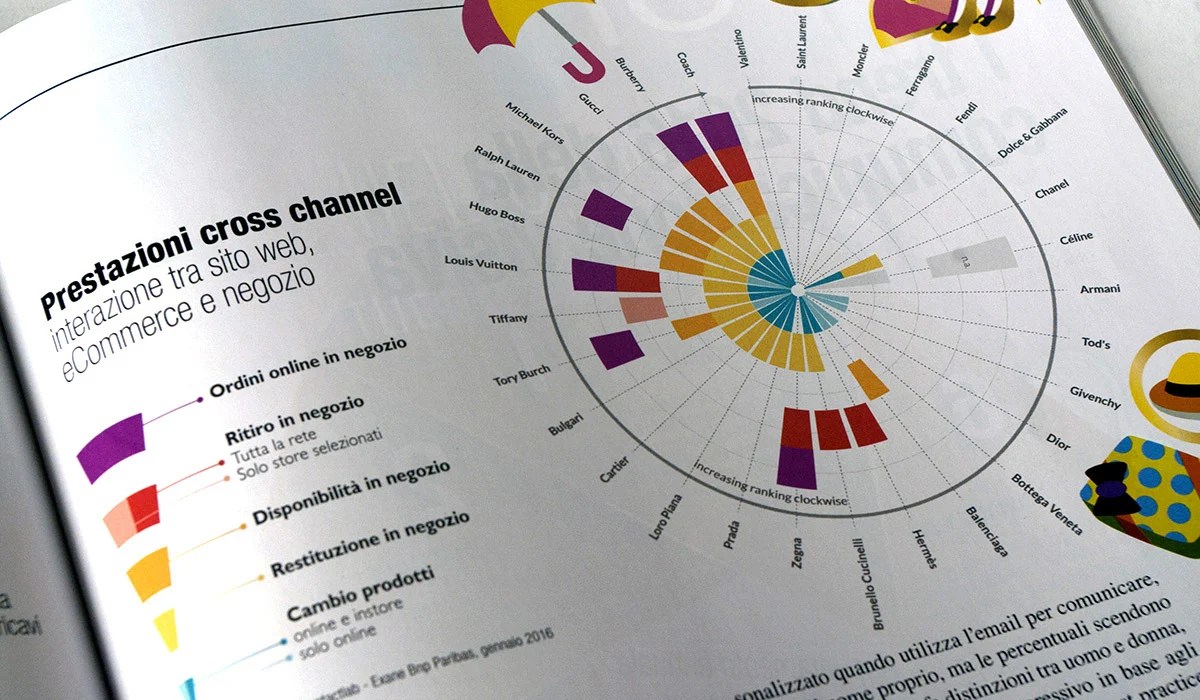
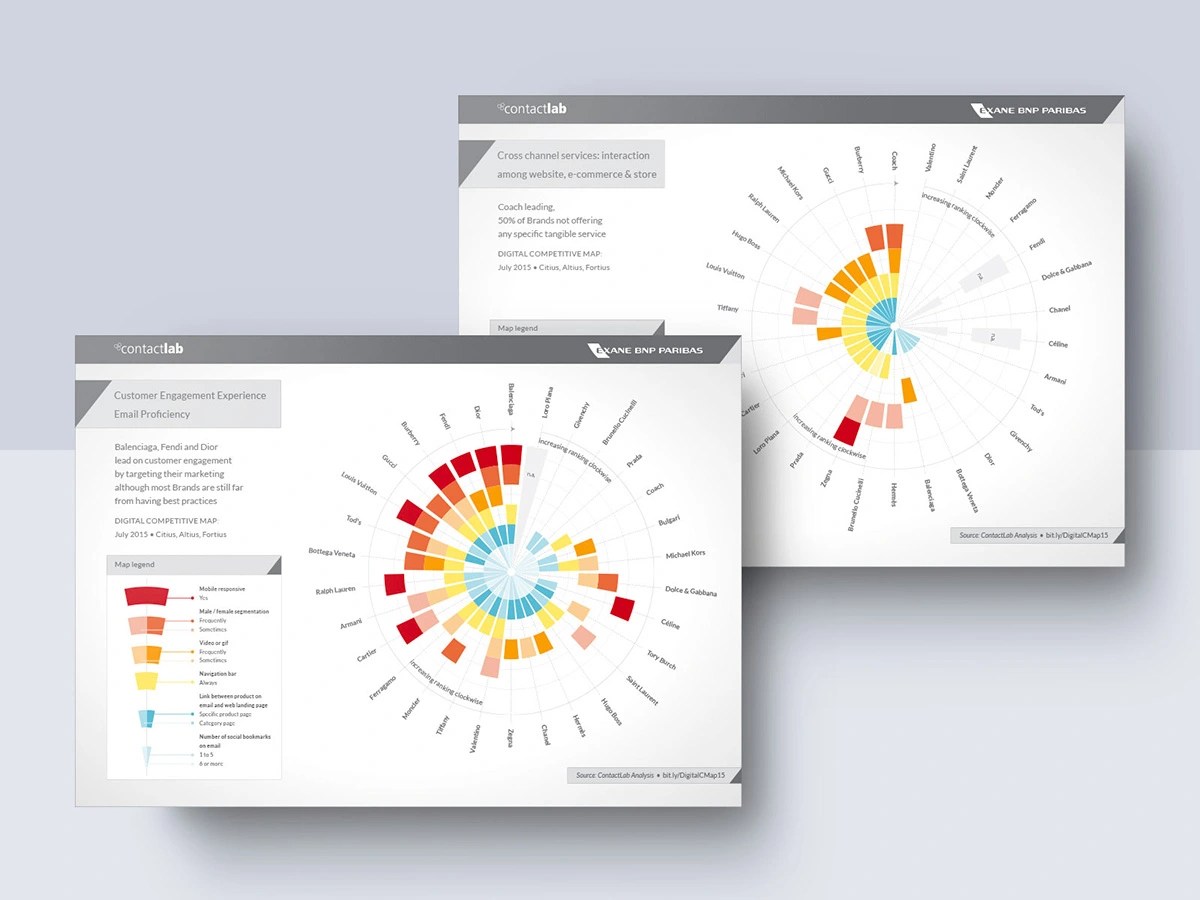
Luxury brands digital strategies from the periodic report issued by Contactlab and Exane BNP Paribas (data visualization concept & design).
Published on “Mark Up” magazine on May 2016.
Infographics can bring data to life, guiding the viewer while capturing attention. Here, a circular, clock-like grid presents a competitive positioning map in an innovative way, reflecting the cutting-edge digital strategies of luxury brands. Another uses a color gradient – from cool to warm – to show average online product prices, making complex information instantly readable.